Particle Size Distribution Analysis
This image illustrates the post-analysis phase of a manual sieve test for determining particle size distribution, where eight green sieves laid out on dry, cracked earth display separated granular materials ranging from coarse fractions in the bottom-left to fine silt or clay in the bottom-right. The arrangement indicates that the sieves, originally stacked by descending mesh size, have been disassembled to reveal the retained material fractions, serving as the visual foundation for calculating metrics like D10 or D50 to characterize soil or aggregate properties in geotechnical and materials science applications.
This image depicts a manual sieve analysis setup for Particle Size Distribution (PSD) Analysis, commonly used in geotechnical engineering, agriculture, or materials science to determine the grain size distribution of granular materials like soil, sand, or mineral powders.
Key Observations:
Sieve Stack Disassembly:
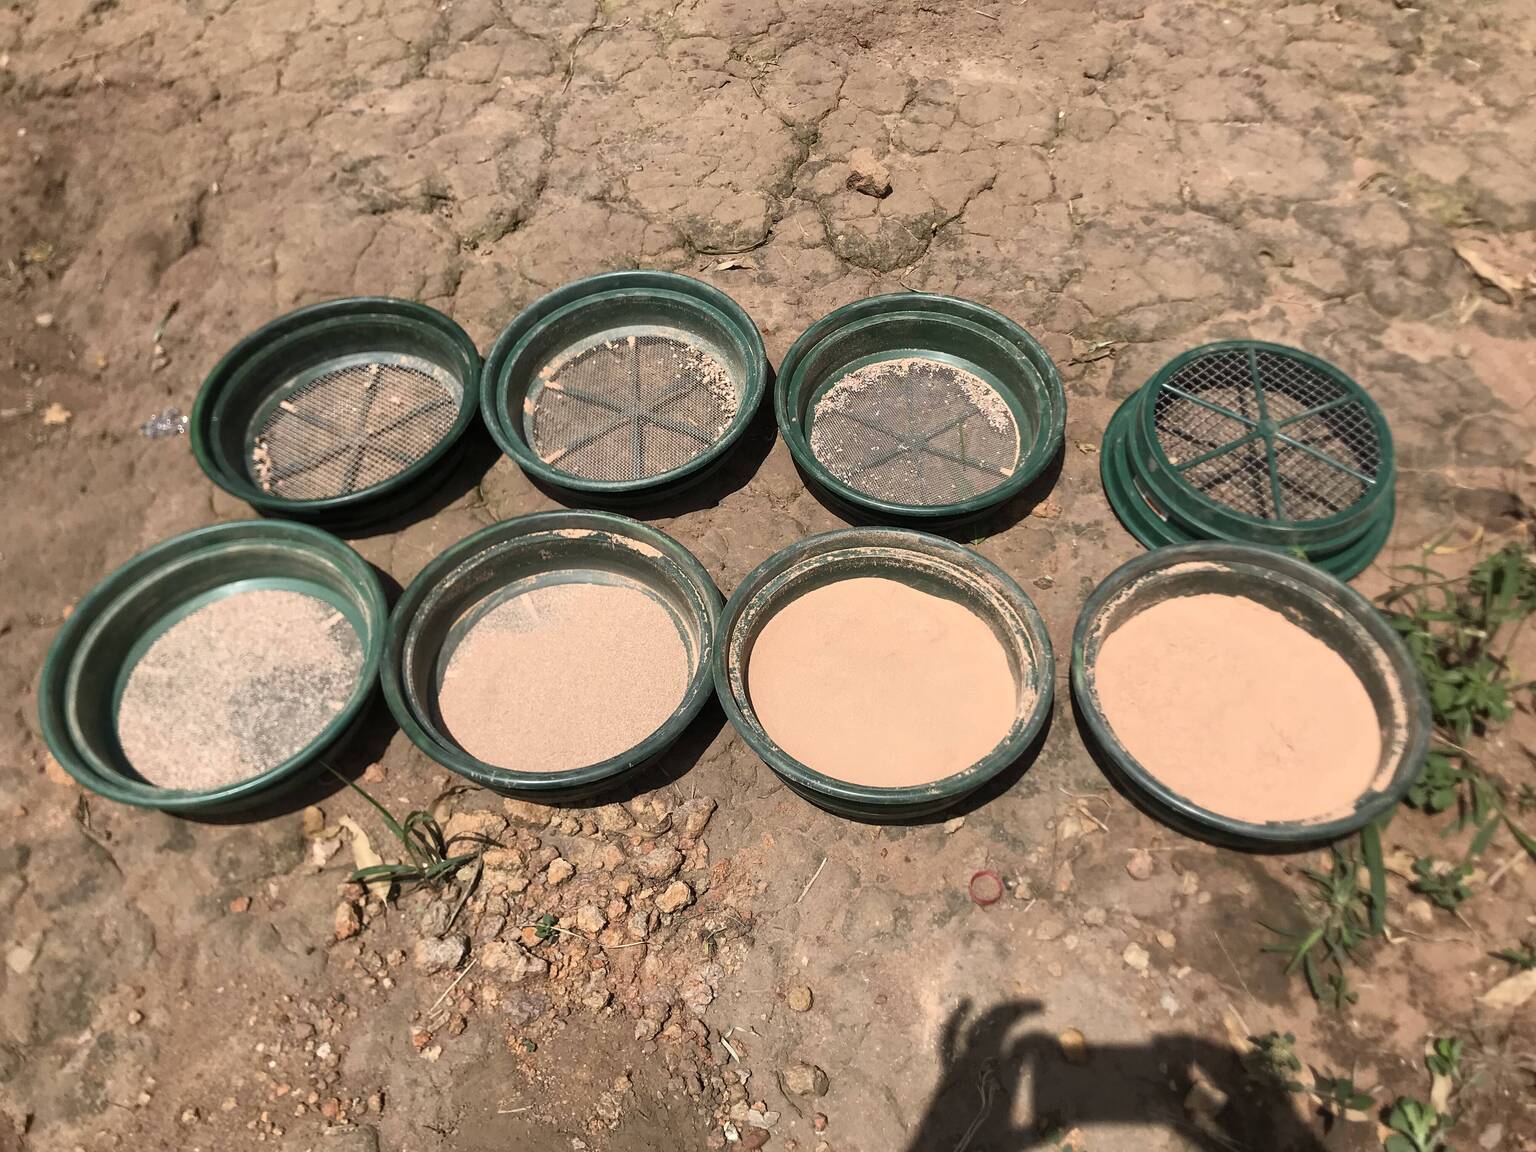
- The image shows eight green circular sieves laid out on dry, cracked earth — likely outdoors after a manual sieve test.
- The sieves are arranged in two rows: four in the top row (mostly empty or with minimal residue) and four in the bottom row (filled with progressively finer material).
- This arrangement suggests the sieves were originally stacked vertically (from largest to smallest mesh aperture), then separated post-analysis to weigh retained material on each screen.
Residue Distribution:
- Bottom row (left to right): Increasingly fine material is retained — from coarse sand/gravel on the left to very fine silt/clay-like powder on the right. This indicates successful separation by particle size.
- Top row: Mostly empty or with minimal residue, suggesting those were the finer sieves that let most material pass through — or perhaps they were placed at the top of the stack during shaking.
Sieve Mesh Patterns:
- Some sieves show visible mesh patterns (e.g., star-shaped or radial supports), typical of standard laboratory sieves (like ISO or ASTM series).
- One sieve (top right) appears to have a different mesh pattern — possibly a different aperture size or type (e.g., for finer fractions).
Field Context:
- The setting is informal — on bare, dry soil with small pebbles and weeds — indicating this may be a field-based or low-resource lab test rather than a controlled environment.
- Shadows suggest daylight conditions.
In Context of Particle Size Distribution Analysis:
- Purpose: To quantify how much of the total sample mass falls within specific particle size ranges (fractions).
- Methodology: A known mass of sample is shaken through a stack of sieves arranged in descending order of mesh size. After settling, each sieve is weighed to determine the mass retained on it.
- Data Output: The results are typically plotted as a cumulative curve (% passing vs. particle diameter), yielding metrics like D10, D50, D90, or uniformity coefficient (Cu) and curvature coefficient (Cc).
Interpretation of This Setup:
- The bottom-right sieve contains the finest fraction — likely < 0.075 mm (passing #200 sieve) — classified as silt or clay.
- Moving leftward in the bottom row, particle sizes increase — coarse sand, fine sand, maybe small gravel.
- The top row’s near-empty sieves suggest either very fine material passed through them, or they were positioned incorrectly during stacking (less common).
- The presence of multiple sieve sizes implies a broad PSD range was being analyzed — perhaps from gravel down to clay.
Limitations & Notes:
- Manual sieving is less precise than laser diffraction or sedimentation methods for very fine particles (< 0.063 mm), but still widely used for soils and aggregates.
- No balances or weights are visible — so quantification hasn’t yet occurred; this is just the visual separation phase.
- The outdoor setting raises concerns about contamination or moisture loss, which could affect accuracy.
Summary:
This image captures the post-analysis stage of a manual sieve test, where granular material has been separated into discrete particle size fractions using a series of sieves. The spatial arrangement reflects the grading process: coarser fractions retained on lower-numbered (larger aperture) sieves, finer fractions on higher-numbered (smaller aperture) ones. It illustrates the foundational step in generating a Particle Size Distribution curve, essential for characterizing soil behavior, concrete aggregate suitability, or fertilizer particle dynamics.
Note: For accurate PSD analysis, each sieve should be weighed after tapping or air-drying to remove clinging fines, and the sum of retained masses should equal the original sample mass (within experimental error).